Duke Energy (DUK)·Q4 2025 Earnings Summary
Duke Energy Beats Q4, Raises 2026 Guidance Above Consensus on $103B Capex Plan
February 10, 2026 · by Fintool AI Agent
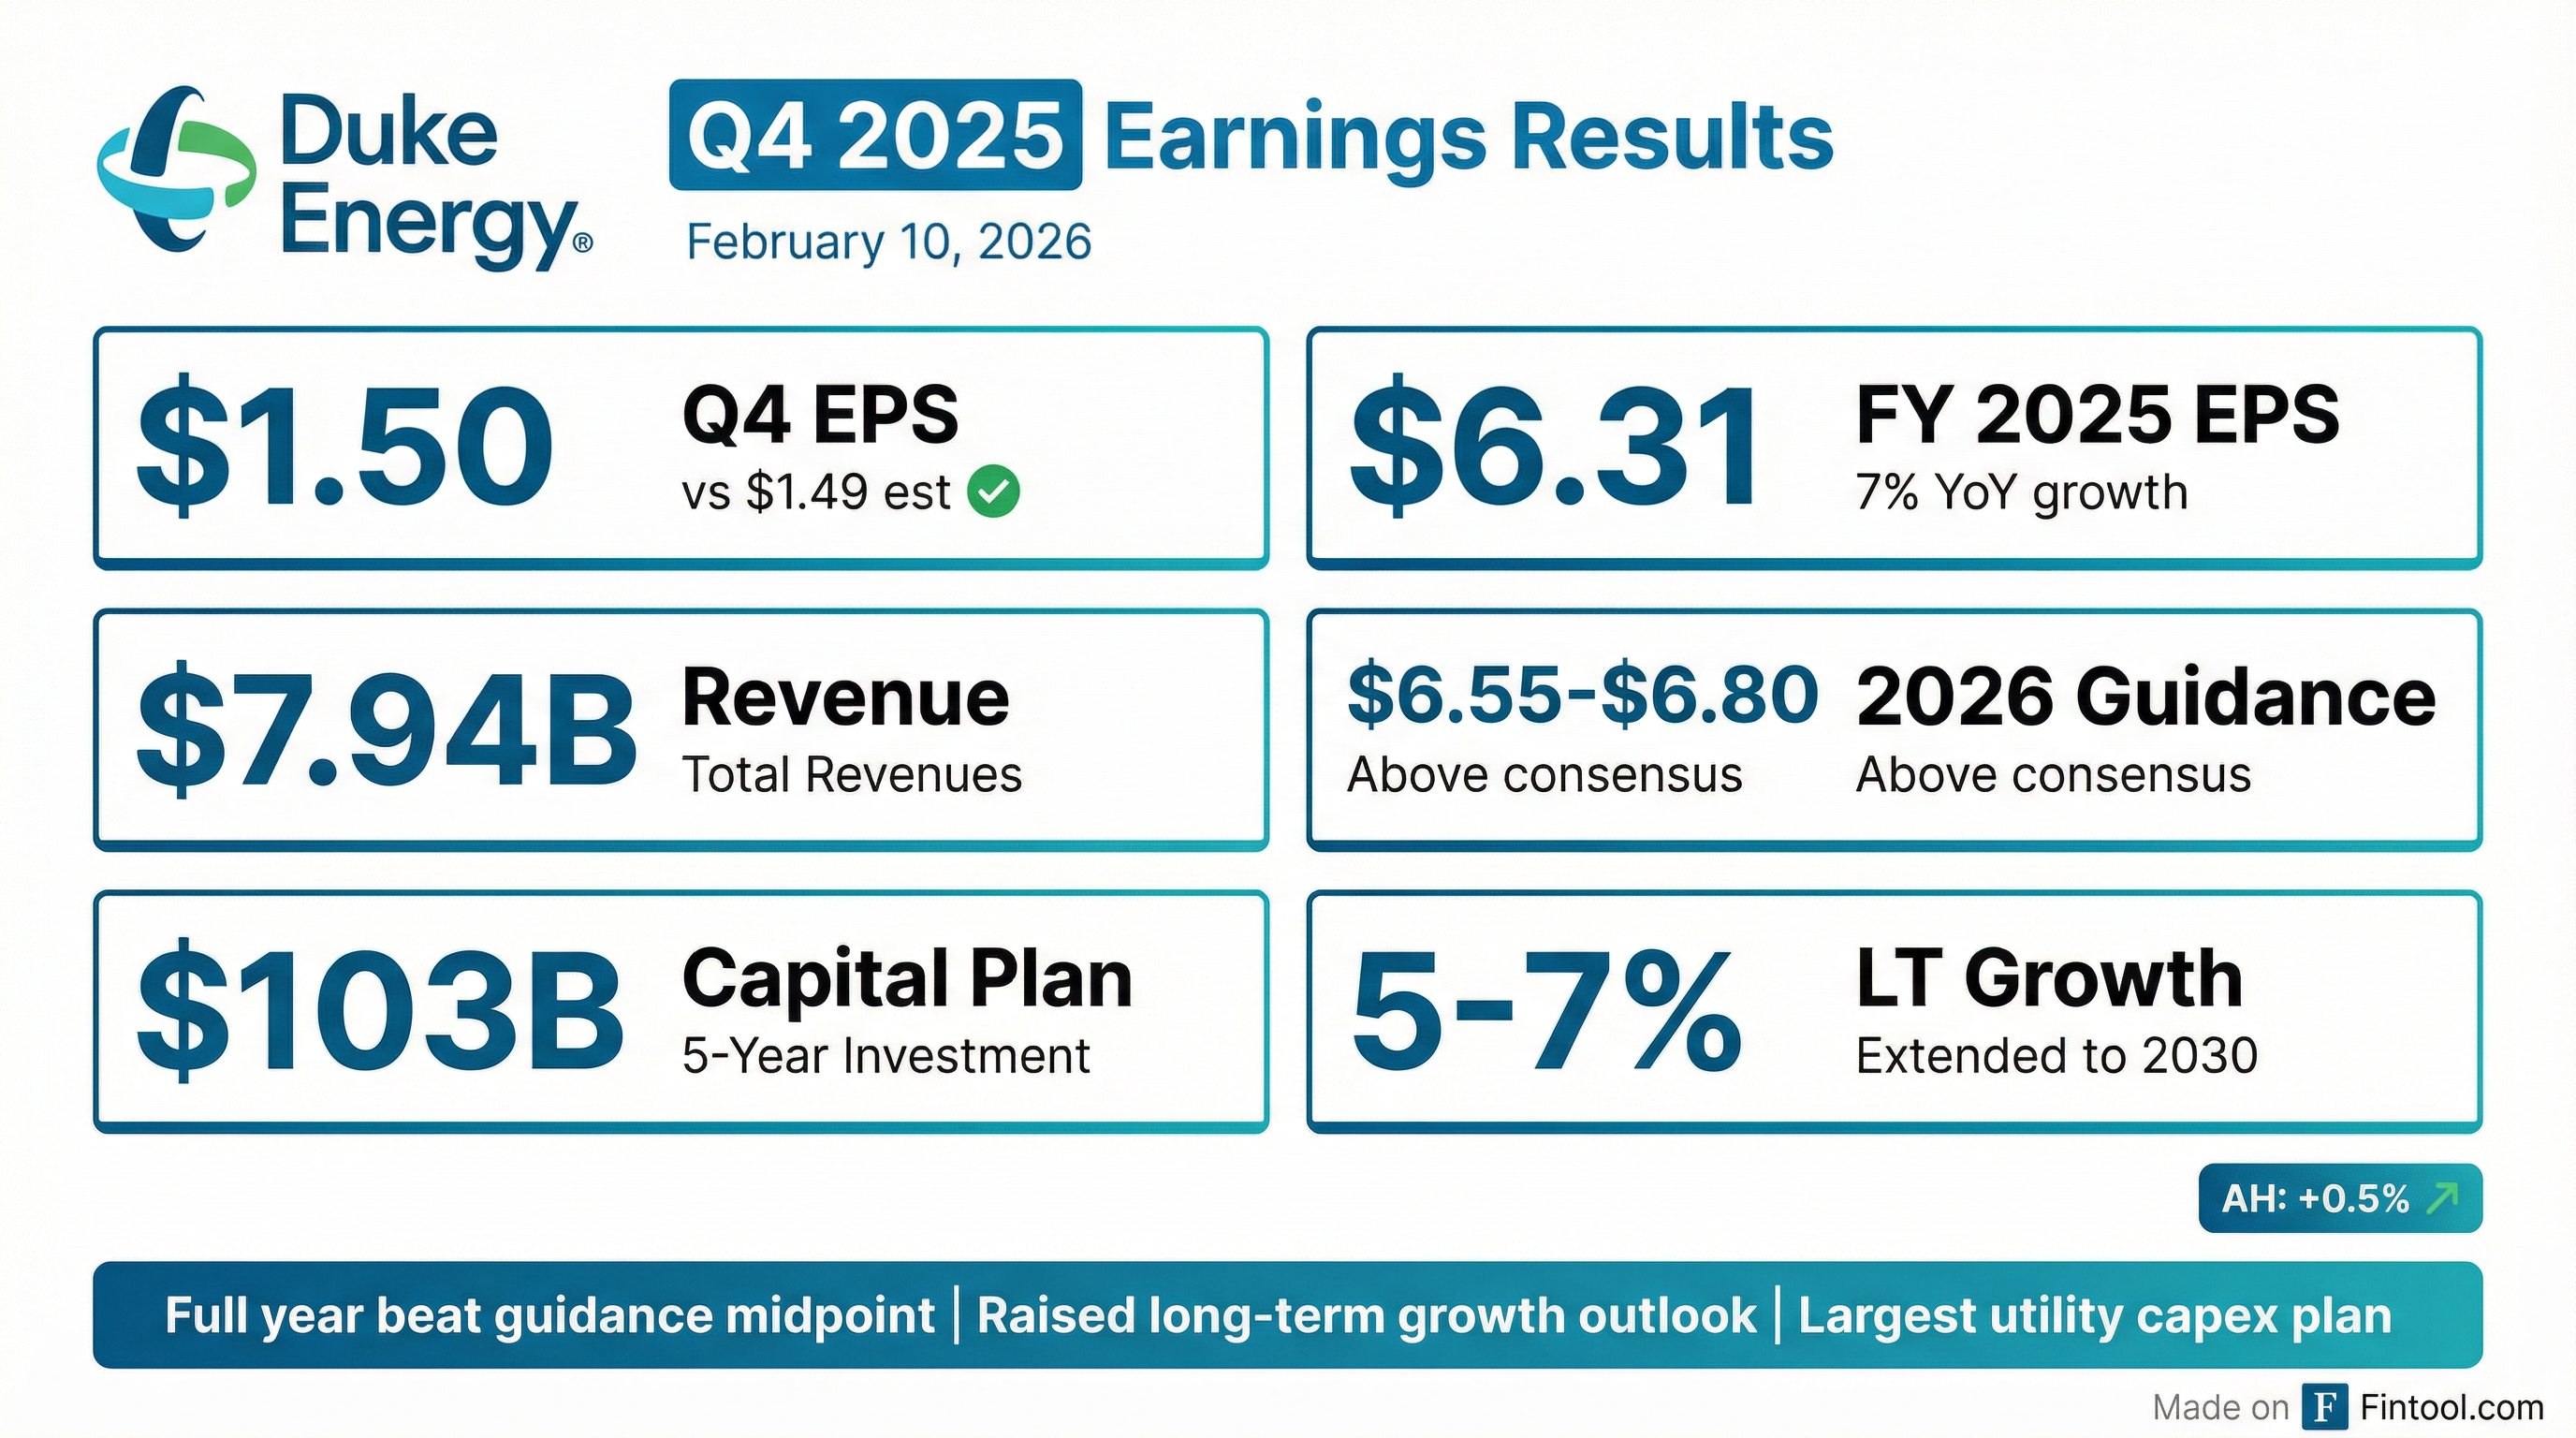
Duke Energy delivered a solid close to 2025, posting Q4 adjusted EPS of $1.50 that edged past Street expectations, while full-year results of $6.31 beat the guidance midpoint. The headline: management introduced 2026 guidance well above consensus and unveiled the largest regulated utility capital plan in the industry at $103 billion over five years.
Did Duke Energy Beat Earnings?
Yes, on both EPS and revenue. Q4 2025 adjusted EPS of $1.50 beat the Street estimate of ~$1.49. Revenue of $7.94 billion topped expectations of $7.59 billion by 4.6%.
The YoY EPS decline was expected—Q4 2024 benefited from $0.12/share of one-time items (regulatory matters, asset sales, storm deductibles) that didn't repeat. On an apples-to-apples basis, Duke delivered.
Full-year 2025 adjusted EPS of $6.31 beat both guidance midpoint ($6.30) and the prior year's $5.90, representing 7% YoY growth.
What Did Management Guide?
2026 guidance came in well above consensus. Duke introduced adjusted EPS guidance of $6.55 to $6.80 for 2026, with a midpoint of $6.675. This is approximately 5.8% above the prior analyst consensus of $6.31.*
*Values retrieved from S&P Global
Management also extended the long-term growth outlook:
- 5-7% adjusted EPS growth rate now runs through 2030 (previously 2029)
- "Confidence to earn in the top half of the range beginning in 2028"
What Changed From Last Quarter?
The capital plan got bigger. In Q3 2025, Duke telegraphed a new 5-year plan of "$95 to $105 billion." Today they delivered $103 billion—at the high end of that range.
The $103 billion plan drives 9.6% earnings base growth through 2030—fuel for the 5-7% EPS CAGR.
What's the $103B Capital Plan?
Duke Energy unveiled the largest regulated utility capital plan in the industry—$103 billion over 2026-2030, an ~18% increase from the prior plan.
Generation Additions: ~14 GW by 2031
Duke is adding massive new generation capacity to serve growing jurisdictions:
Gas Generation (~7.5 GW sited):
- 20 gas turbines secured through GEV partnership agreement
- EPC contracts signed for first ~5 GW of projects
- Gas supply contracted for all announced plants
Renewables & Storage:
- ~4.5 GW of battery storage capacity online by 2031
- 305 MW of solar and 175 MW of storage placed in service in 2025
Fleet Uprates:
-
1 GW of uprates through 2031: gas (~670 MW), nuclear (~250 MW), hydro (~85 MW)
Advanced Nuclear:
- Early site permit submitted for potential SMR at Belews Creek (December 2025)
- Permit receipt expected in 2027
Load Growth Driving Investment
The Carolinas Resource Plan (filed October 2025) projects 2035 energy demand +7% higher than the prior plan, driven by data centers and advanced manufacturing.
Data Center Customer Details:
- Since Q3 2025: Signed 1.5 GW of new ESAs with Microsoft and Compass
- Total signed ESAs: 4.5 GW of data center load secured under contract
- Late-stage pipeline: ~9 GW being worked through (double the signed amount)
- Data centers now comprise ~75% of economic development by 2030 (vs. 50% a few quarters ago)
- Ramp timing: ESAs start coming online late 2027, ramping materially in 2028
How Did Segments Perform?
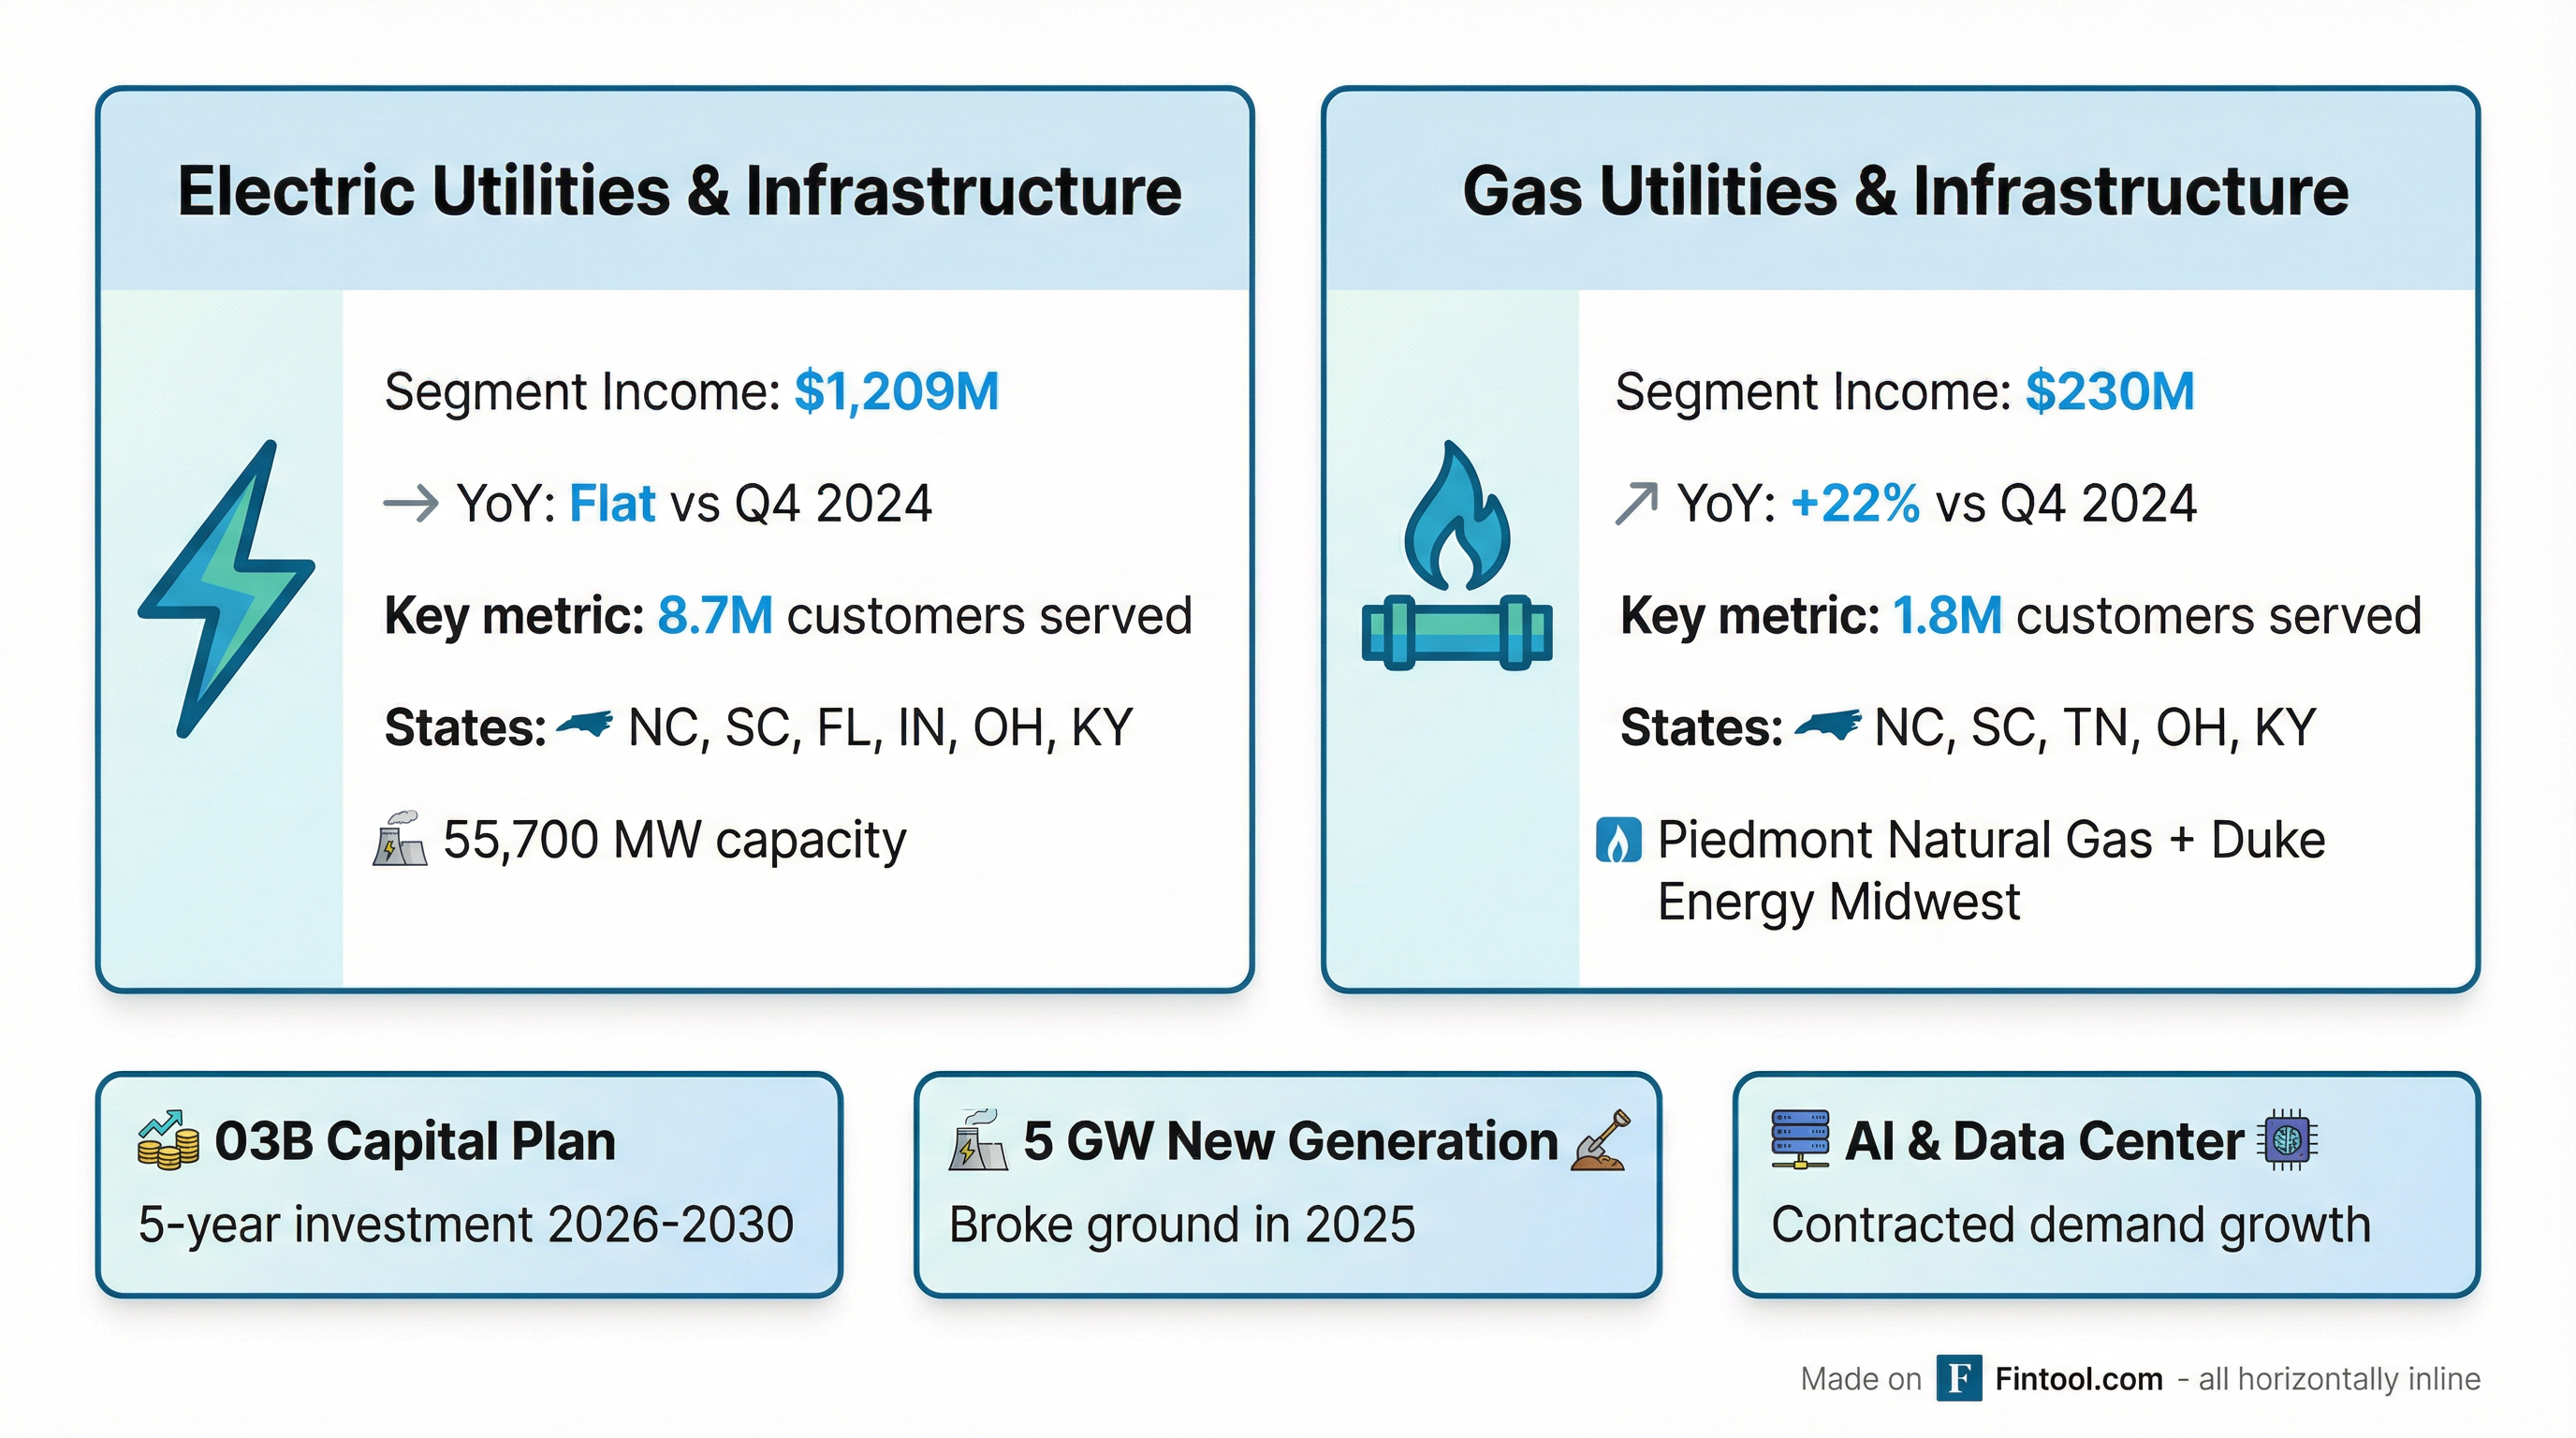
Electric Utilities & Infrastructure
The core business held steady:
Lower quarterly results were driven by higher O&M, depreciation on a growing asset base, and interest expense—partially offset by rate recovery.
Operational highlights:
- Weather-normalized retail sales growth: +0.4%
- Customer count growth: +1.5% (8.67M customers)
- Nuclear capacity factor: 97%
- Winter storm response: 200,000 outages, 95% restored within 24 hours—testament to grid-hardening investments
Gas Utilities & Infrastructure
Gas segment income held flat at $230M vs. $231M adjusted in Q4 2024. Recovery of infrastructure investments offset higher O&M and taxes.
Q&A Highlights
On ESA execution confidence:
"The ESAs that we've signed, all of those are under construction. They're turning dirt. They have zoning in hand. So we don't anticipate any of those backing out."
On the data center pipeline:
"Our pipeline in the late stage, the ones that are moving through the funnel at pace, is about double that [4.5 GW]. So you think about 9 gigawatts is what we're working through, and you should expect new announcements over the course of 2026."
On storm costs and 2026 guidance:
"We budget for storms... we have really good recovery mechanisms in place that allow us to defer costs for future recovery that are above a certain deductible level. So no impact to the guidance for 2026."
On data center interruptibility:
"That's been one of the provisions [in contracts]. It helps us get them online faster... having that ability to curtail their load or have them go on their backup generation for 50 hours or so a year."
On rate case strategy and affordability:
"We have a lot of tools in our bag with tax credits, our one utility merger... We have a good case if we get to litigation. But in the past, we've always tried to settle or settle portions and have a constructive track record of doing that."
On the rate base CAGR:
"The 9.6%, if we took out the minority investment in Florida that's going to happen during this five-year window, would knock the CAGR to 8.8%."
Key Management Quotes
CEO Harry Sideris delivered a confident tone:
"The fourth quarter marked a strong finish to a productive year, where we met every financial goal, progressed our economic development pipeline, broke ground on 5 gigawatts of new dispatchable generation resources, and continued to deliver value for customers."
"We enter 2026 with incredible momentum. The fundamentals of our business have never been stronger, and we operate in some of the most attractive jurisdictions in the nation."
On the AI/data center opportunity:
"With the largest regulated capital plan in the industry, a balance sheet prepared for growth, and contracted demand from AI and advanced manufacturing, we are well-positioned to deliver 5% to 7% EPS growth through 2030."
How Did the Stock React?
Duke Energy shares were essentially flat in regular trading on February 9 (the last trading day before earnings) at $121.86. In aftermarket trading following the release, shares ticked up to $122.41, a gain of approximately 0.5%.
The muted reaction suggests the beat was largely in-line with buy-side expectations, and the guidance raise was anticipated after management's Q3 commentary.
What's the Balance Sheet Position?
Duke strengthened its balance sheet to support the massive capex plan:
Equity Financing Plan:
- $10 billion in common equity issuances expected 2027-2030 via DRIP/ATM
- Reflects ~35% equity funding of incremental capital (within 30-50% guidance)
- Average annual issuances represent ~2.5% of market cap
Asset Sales:
- Tennessee sale on track to close March 31, 2026
- First closing of Florida transaction expected early 2026
- Transaction proceeds satisfy 2026 equity needs
What Rate Cases Are Pending?
Duke filed significant rate cases in North Carolina in November 2025:
Despite the large capital plan, management emphasizes customer affordability:
- Estimated customer bill impact CAGR of 2.1% over the next decade—lower than inflation
- Customer rates remain below U.S. averages across most jurisdictions
- DEC & DEP combination expected to generate >$1B customer savings
What's the Investment Thesis Now?
Investor Value Proposition (per management):
- 3.5% dividend yield (as of February 6, 2026)
- 5-7% long-term EPS growth through 2030
- ~10% risk-adjusted total shareholder return at constant P/E
Bull Case:
- $103B capex plan is the largest in regulated utilities, driving predictable rate base growth
- AI/data center load growth provides demand visibility that most utilities lack
- 5-7% EPS growth through 2030 with "confidence in top half" starting 2028
- Rates below national average + bill increases below inflation = regulatory goodwill
- Record 96.87% nuclear capacity factor—27th consecutive year exceeding 90%
- ~$600M in nuclear tax credits generated for customer benefit
Bear Case:
- Higher interest expense continues to pressure earnings (-$0.06/share YoY in Q4)
- O&M inflation is a persistent headwind (-$0.17/share YoY in Q4)
- Coal ash remediation remains a long-term liability
- Execution risk on $103B capex program requiring $10B equity issuance
- FFO/debt of 14.8% leaves limited cushion above rating agency thresholds (200bps above Moody's, 300bps above S&P)
Forward Catalysts
Key 2026 Assumptions
Key Earnings Sensitivities
Management provided 2026 EPS sensitivities:
Full-Year Financial Summary
Read More: